
New financial data from Roy Morgan’s Wealth Report revealed that Macquarie Bank has the wealthiest customers among the larger banks in Australia.
In March, Macquarie’s customer net wealth per capita was an impressive $943,000.
Macquarie customers not only have higher incomes but are also more likely to own or be paying off homes, which is a significant source of wealth in Australia.
See LinkedIn post here.
St George Bank follows in second place with a net wealth per capita of $662,000, primarily due to its strong customer base in Sydney, where housing prices are the highest in the country.
Westpac comes in third with $646,000, benefiting from an older customer base that has had more time to accumulate wealth.
Bank of Queensland ranks fourth with a net wealth per capita of $614,000, reflecting Brisbane’s recent rise in property values.
ING, the digital-only bank, has a net wealth per capita of $503,000, with a younger customer demographic mainly comprising Gen X and Gen Y.
The Commonwealth Bank (CBA) has the lowest net wealth per capita among the banks reported, at $474,000. CBA’s younger customer base, predominantly Gen Z, has had less time to accumulate wealth.
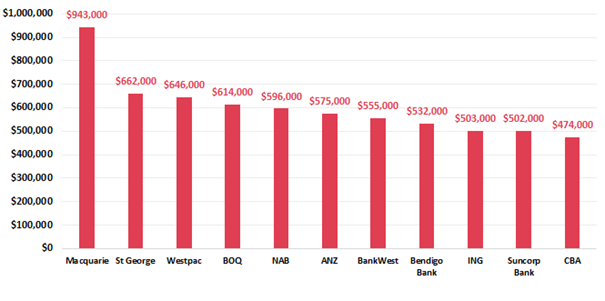
Customer average per capita net wealth: March 2024
Source: Roy Morgan Single Source Australia, Apr. 2023 – Mar. 2024, n = 64,597. Base: Australians aged 14+. *The eleven banks reported have a minimum sample size of at least 1,450 for the period reported.
Roy Morgan CEO Michele Levine (pictured above) explained the wealth disparity.
“Although overall net wealth per capita in Australia is $503,000, the level of wealth varies greatly between the customers of the larger banks, ranging from $943,000 among Macquarie customers to $474,000 among customers of CBA,” Levine said.
Levine highlighted the influence of real estate prices and generational profiles on wealth distribution.
“These wide variations in overall net wealth per capita across the larger banks have a lot to do with real estate prices in Sydney, which are higher than anywhere else in Australia. The banks with the greatest proportion of customers living in Sydney are Macquarie and St George,” she said.
“Another factor that helps explain the difference in overall net wealth per capita between the banks is the banks’ generation profile. Net wealth per capita is highest among Baby Boomers, and banks with customer bases skewed to Baby Boomers tend to have higher net wealth.”
Levine encourages a deeper understanding of these differences.
“Understanding these differences between locations and generations in net wealth levels across the larger banks presents valuable insights into how and why wealth is distributed in Australia as it is,” she said.
Further detailed analysis can be found in the newly released Roy Morgan Wealth Report June 2024.”
Get the hottest and freshest mortgage news delivered right into your inbox. Subscribe now to our FREE daily newsletter.