
Australia’s housing market has recorded a 39.1% increase in national home values over the past five years, according to CoreLogic’s April 2025 Housing Chart Pack.
This rise equates to a median dwelling value gain of approximately $230,000, driven by sustained demand, tight housing stock, and underlying economic stability. While a significant increase, CoreLogic noted that this growth is not as steep as past boom periods.
Monthly growth is showing signs of softening, with national values rising just 0.7% over the past quarter, amidst strong listings growth, high interest rates, anticipated rate cuts, and persistent cost-of-living pressures.
The report also highlighted that properties are staying on the market longer, with median days on market increasing to 40, up from 30 a year earlier. These metrics suggest a cooling pace of appreciation, though conditions remain positive overall.
“Outside of a few short months of declines, values have seen strong upward pressure over the past five years, driven by low stock levels and increased demand,” said Kaytlin Ezzy (pictured), economist at CoreLogic (soon to rebrand as Cotality).
“But this growth cycle remains moderate compared to earlier periods, when financial deregulation, strong economic growth and favourable demographic shifts helped fuel remarkable value growth.”
While recent growth is strong in dollar terms, it pales in comparison to historical five-year surges. According to CoreLogic, national home values jumped 75.5% in the five years to March 1989 and 79.7% in the five years to December 2003.
These periods were shaped by powerful macroeconomic factors, including the deregulation of financial markets, falling interest rates, and government incentives such as capital gains tax exemptions for primary residences and the introduction of first-home buyer grants.
“While around half the increases seen during the previous peaks, when adjusted to the current median value, the rise seen over the past five years is equivalent to a roughly $230,000 increase,” Ezzy said.
By contrast, she noted that the 2003 cycle saw a dollar rise of $140,000, while the 1980s boom delivered a $60,000 gain—substantially smaller due to lower base prices.
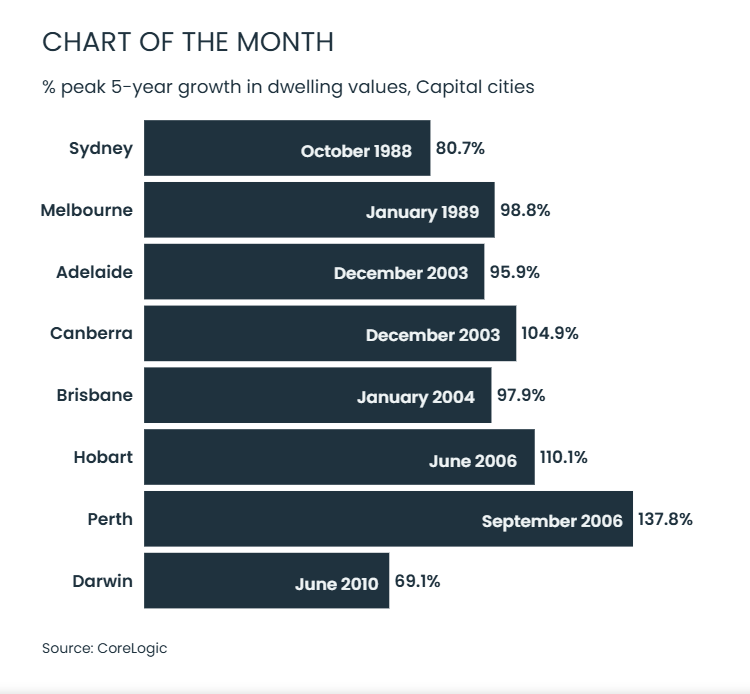
Although Sydney and Melbourne recorded their largest five-year gains in the 1980s and early 2000s, Perth leads all capitals historically with a staggering 137.8% increase in the five years to September 2006. This was largely driven by mining-driven migration and economic strength.
“Strong economic condition and positive interstate migration amid the 2000’s mining boom, saw housing values in the western capital skyrocket before falling through much of the 2010’s,” Ezzy said.
In contrast, Brisbane, Hobart, and Adelaide saw their most significant growth in the mid-2000s, supported by affordability, rising migration, and positive economic fundamentals.
Key takeaways from CoreLogic’s April 2025 Chart Pack include:
Taken together, these figures point to a housing market that remains resilient but is transitioning into a more moderate phase.
While affordability and borrowing capacity continue to challenge many buyers, overall conditions suggest a market adjusting to post-COVID norms with greater balance between supply and demand.
A full breakdown is available via CoreLogic Australia’s April Housing Chart Pack.