
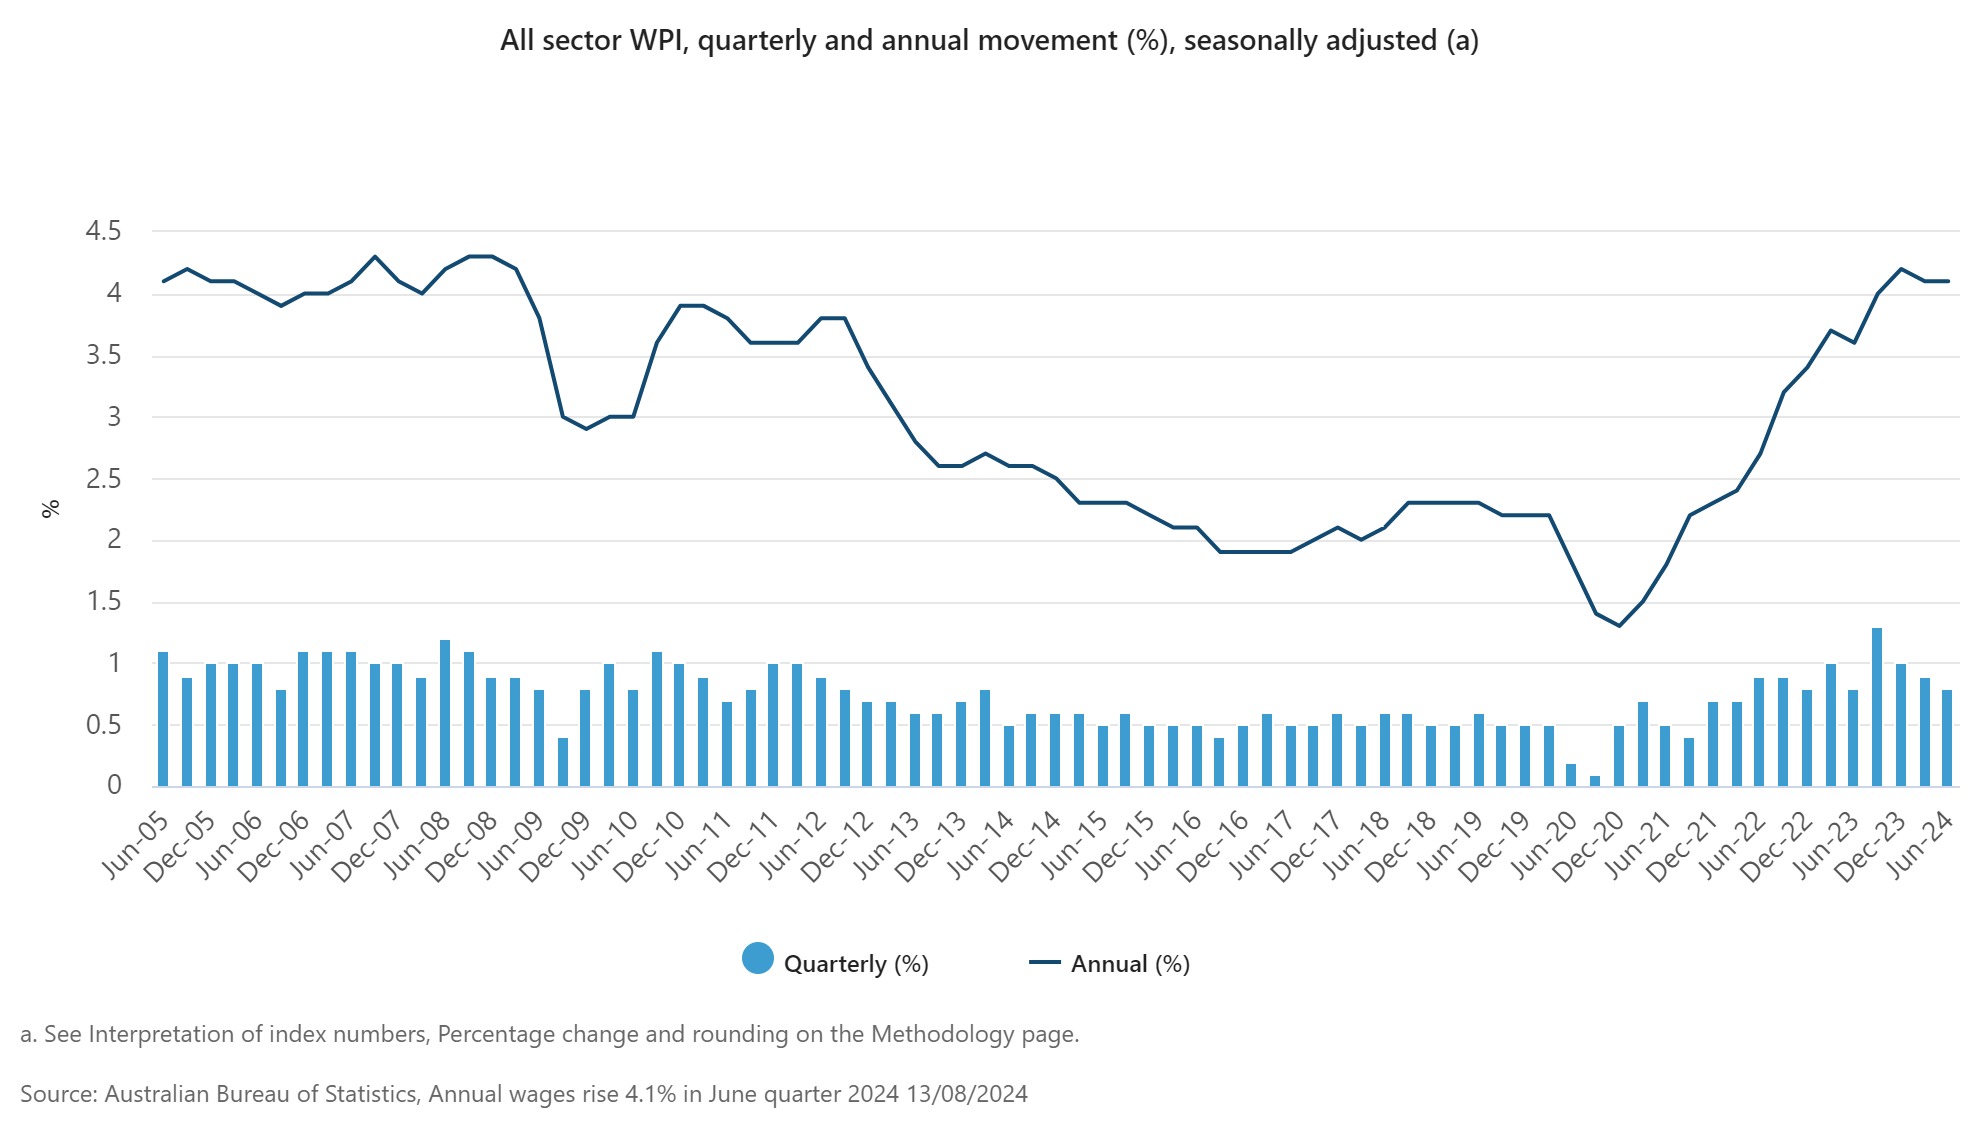
While the official ABS data showed the Wage Price Index (WPI) rose 0.8% in June quarter 2024, and 4.1% for the year, the reality on the ground might be over double that, according to payroll platform Employment Hero.
Employment Hero’s Monthly employment report found quarterly median wage growth was actually up 2.0% and 8.8% over the year, which according to the company’s CEO and chief economist Ben Thompson, showed “wageflation is getting worse”.
“It’s putting extreme pressure on Australian small businesses,” said Thompson (pictured above left).
Thompson said there is a current lack of real-time transparency in the employment marketplace and what someone is worth today is not necessarily what they were worth yesterday.
“As it stands, the data that employers and job seekers have access to is either out of date, unverified or not revealing the complete employment picture,” he said.
“This is especially true with wage data. Because of this the market is negotiating blindly.”
The discrepancy in data paints a contrasting picture of Australia’s wage growth as the RBA looks towards critical data sets to determine their next move on the official cash rate.
Over the June quarter, private sector wages grew by 0.7%, down from 0.9% in the March quarter 2024, according to the ABS data released on Tuesday, the lowest quarterly rise since December 2021.
Annual wage growth in the private sector was 4.1% in June quarter 2024, following three consecutive quarters at 4.2 % and higher than the 3.9 % growth recorded this time last year.
On the other hand, public sector wages rose 0.9%, up from 0.6% in the March quarter 2024.
Michelle Marquardt (pictured above centre), ABS head of prices statistics, said this was partly because all Australian Public Service employees received pay increases effective March 14.
“This led to a larger increase in the contribution Commonwealth jobs made to public sector wage growth. Pay rises for these jobs had previously been paid at different times across quarters depending on the timing of individual agency agreements,” she said.
A separate NAB survey showed business conditions (which measure sales, employment and profitability) rose to six points in July 2024 to be only slightly below their long-run average. Confidence declined two points to one with falls across industries except construction and recreation.
Tim Keith (pictured above right), managing director of Cap Space, a private credit investment manager and non-bank lender, said both sets of data highlight the fine balancing act the central bank has in setting interest rates next month.
“While the Reserve Bank of Australia (RBA) kept interest rates on hold in August, there is still a chance that it could raise interest rates in September, given inflation remains sticky, wages growth is still relatively high despite some cooling in the private sector, and business conditions in the economy remain robust,” he said.
“If the RBA does raise interest rates again, that would be favourable for returns on private credit funds, which are typically floating rate and linked to market interest rates.”
Of course, this would also mean increased mortgage payments for the majority of Australian homeowners on variable interest rates.
While it’s difficult to say how this data will impact the RBA’s decision-making, analysts have made their predictions.
See LinkedIn post here.
With the importance of the RBA’s decision in mind, Employment Hero's latest SmartMatch Employment Report paints a different picture.
From the July figures, the state with the highest wage growth year-on-year is NSW (9.9%) and the state with the lowest is SA (6.7%).
|
State |
Median Hourly Rate |
Month-on-Month change |
Year-on-Year change |
|---|---|---|---|
|
ACT |
$43.90 |
-0.1% |
9.1% |
|
NSW |
$44.30 |
2.9% |
9.9% |
|
NT |
$40.60 |
1.5% |
9.4% |
|
QLD |
$41.80 |
3.1% |
9.4% |
|
SA |
$40.0 |
3.5% |
6.7% |
|
TAS |
$36.60 |
1.7% |
7.3% |
|
VIC |
$41.80 |
1.8% |
8.3% |
|
WA |
$41.0 |
1.8% |
7.6% |
At an industry level, Construction and Trade services saw the highest year-on-year wage growth at 18.0%, followed by Consulting and Strategy at 14.0% and Real Estate and Property at 13.2%.
Among the lowest wage growth were industries such as Sport and Recreation (1.7%), Science and Technology (2.8%), and Design and Architecture (3.7%).
Full-time workers saw the highest year-on-year wage growth with 9.6%, part-time workers at 6.0% and casuals at 5.9%.
Those aged 45-55 command the highest hourly wage at $50.60 and saw their wages increase by 12.0% year-on-year. Those aged 14-17 saw the weakest year-on-year growth at 5.0%.
|
Age |
Median Hourly Rate |
Month-on-Month change |
Year-on-Year change |
|---|---|---|---|
|
14-17 |
$19.10 |
0.2% |
5.0% |
|
18-24 |
$34.20 |
2.1% |
5.8% |
|
25-44 |
$45.40 |
2.5% |
8.6% |
|
45-54 |
$50.60 |
2.0% |
12.0% |
|
55+ |
$44.40 |
2.0% |
9.1% |
Thompson said the “ongoing wageflation” that Employment Hero’s 8.8% wage increase revealed was “an important metric that must be considered by decision makers”, especially when viewed in the context of the RBA’s ongoing battle against inflation.
“The impacts of potentially unsustainable wage growth must also be weighed against ASIC’s findings that business failure rates are nearing recession levels,” Thompson said.
“In terms of this month’s wage jump, we suspect it could reflect the increase in minimum wages and awards that came into effect on July 1.”
The median hourly wage data included in the monthly SmartMatch Employment Report differs from what is reported on by the ABS in a number of ways.
For example, the ABS’ Wage Price Index, which is issued quarterly, is based on a sample of 18,000 jobs drawn from 3,000 private and public sector businesses, according to Thompson.
Survey invitations are sent to businesses of all sizes, with every business given an equal opportunity to participate.
In comparison, Thompson said the SmartMatch wage data is drawn directly from the 300,000 business and over 2 million employees on the Employment Hero platform globally and is informed by real-time payroll data.
“The SmartMatch Employment Report is also issued monthly to give the industry an on-going and up to date snapshot of employment in Australia,” he said.
Additionally, while the ABS focuses on base pay, Employment Hero’s wage data analyses the full compensation package which includes base pay, bonuses, commissions and other forms or remuneration.
“This provides an alternate picture of earnings and gives employers and job seekers a valuable resource for making employment decisions.”
Further information on the methodology behind Employment Hero’s SmartMatch Employment Report and additional metrics can be found here.
The contrasting figures from ABS and Employment Hero underscore the challenges in measuring and forecasting different aspects of the Australian economy.
While the ABS provides the authoritative benchmark, Employment Hero’s real-time data offers a different perspective that highlights potential disparities in wage growth.
This divergence in data highlights the complex challenge for the Reserve Bank of Australia (RBA) as it navigates its monetary policy decisions.
The RBA must sift through various economic indicators, each potentially pointing in different directions, to determine the most appropriate course of action.
As RBA deputy governor Andrew Hauser noted in a recent speech, predicting the precise path of monetary policy is fraught with uncertainty.
“It is right to want to be confident that the central bank will bring inflation back to target and maintain full employment: that is the RBA’s mandate and we should be held to account for it,” Hauser said to the Economic Society of Australia in Brisbane on Monday.
“But the policy strategy required to deliver that outcome, and the economic judgments that inform it, simply cannot be stated with anything like the same degree of certainty. Those pretending otherwise are false prophets.”
In this context, the disparity between ABS and Employment Hero’s data emphasises the need for a nuanced understanding of wage trends and their implications for broader economic policy.
As businesses, employees, and policymakers search for meaning among the economic tea leaves, the challenge remains to balance real-time data with official metrics to craft a path forward.