Australia's economic growth slowed significantly in the March quarter, according to data released by the Australian Bureau of Statistics (ABS).
While the overall GDP managed a meagre 0.1% increase, a deeper concern lies with the ongoing per capita recession – a measure that shows each person’s share of economic output.
Katherine Keenan, ABS head of national accounts, said the weak March GDP figures were the economy’s lowest through-the-year growth since December 2020 following the recent trend.
“GDP per capita fell for the fifth consecutive quarter, falling 0.4% in March and 1.3% through the year."
Where GDP measures the total market value of all goods and services produced in a country, GDP per capita divides the GDP figure by the country’s population.
Therefore, while Australia is still marginally increasing its production, the slice of the pie for the average person has been declining for 15 months.
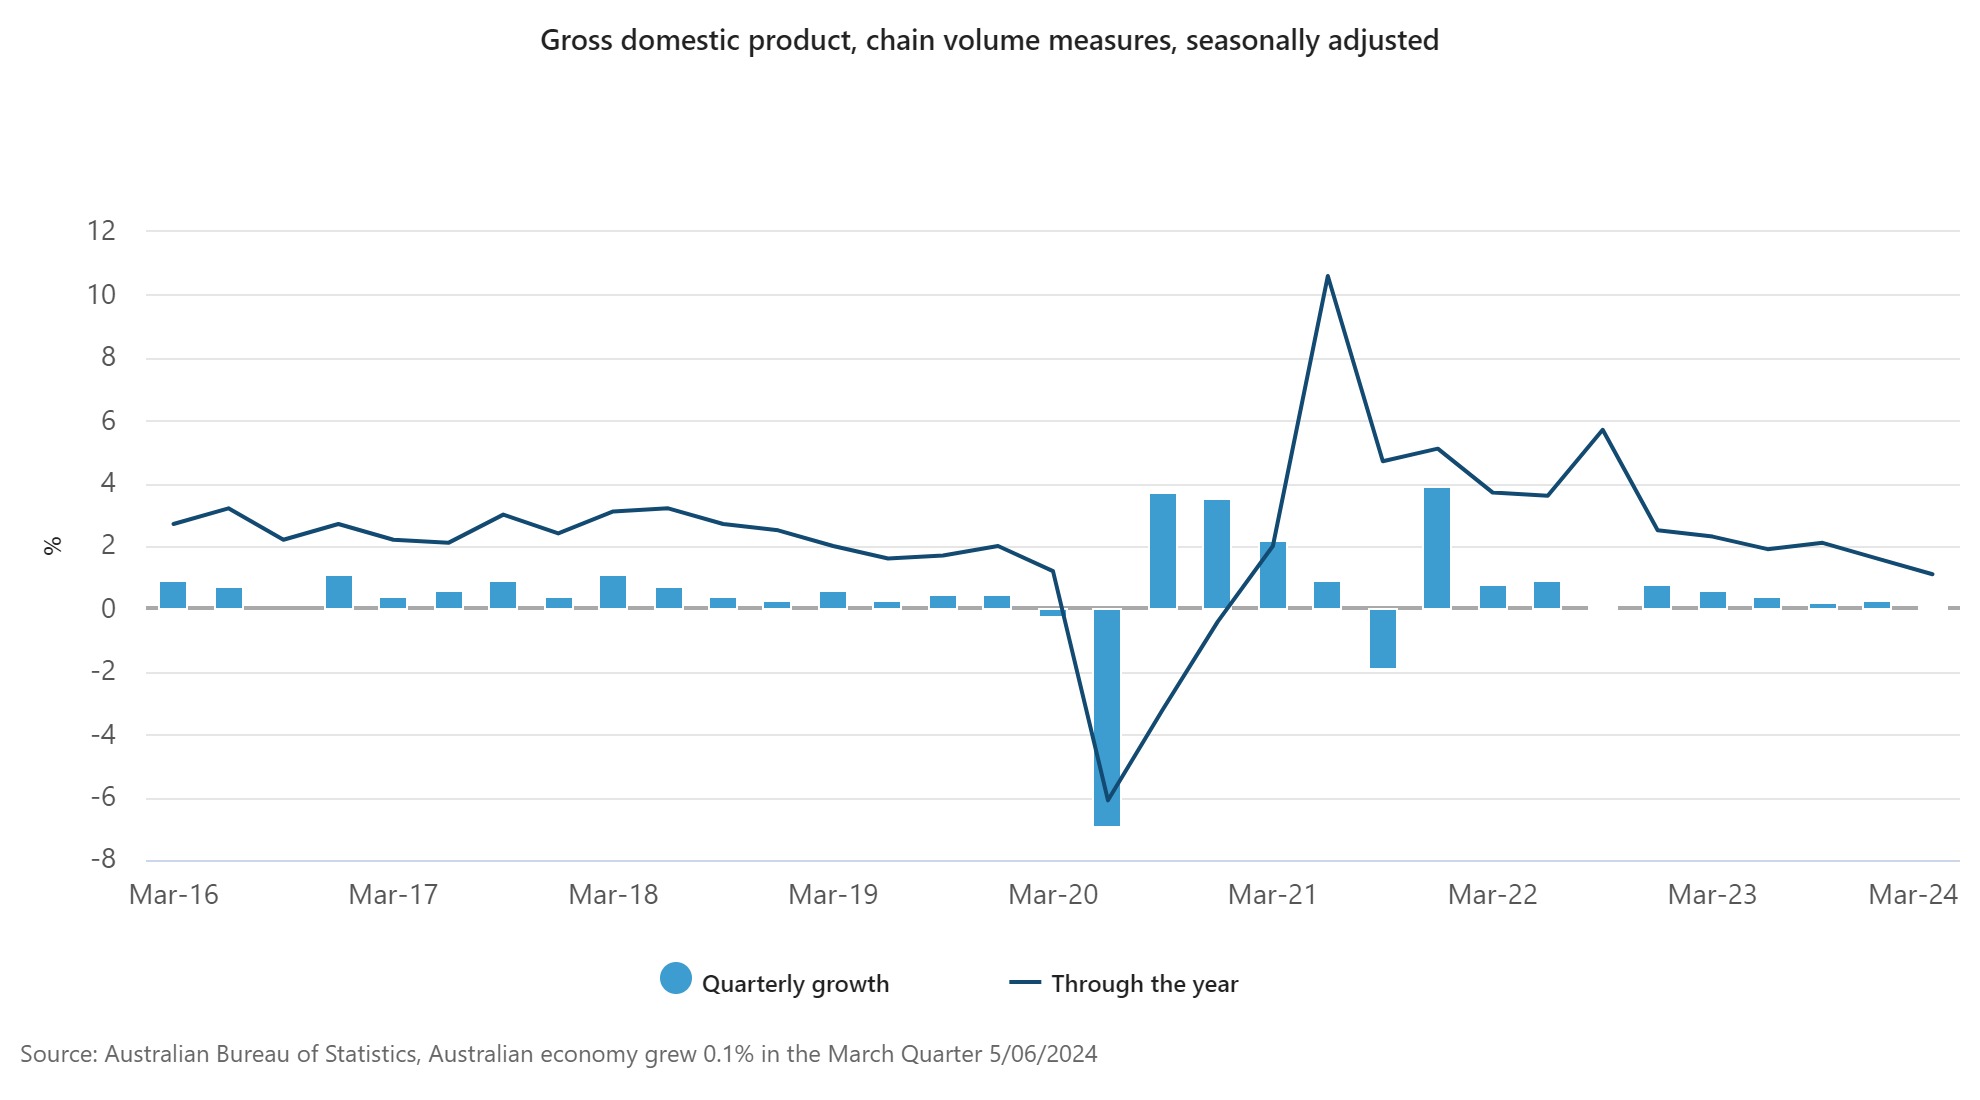
Weak GDP would normally prompt the Reserve Bank to lower interest rates to stimulate the economy, however, sticky inflation is likely to delay that outcome.
Canstar’s finance expert Steve Mickenbecker (pictured above) said borrowers would welcome an early 25-basis-point interest rate cut that could lower monthly repayments on the average $600,000 loan over 30 years by $101 to $3,984.
“The March quarter GDP growth rate has made the already tough job for the Reserve Bank even trickier, potentially setting the economy on the path to recession,” Mickenbecker said.
“The Reserve Bank’s narrow runway has become skinnier, with March quarter CPI growth rising to 1.4% and GDP growth falling to 0.1%. The Reserve Bank will be treading a delicate tightrope between avoiding recession and keeping the credit card genie contained.”
The Reserve Bank is expected to hold the cash rate steady for at least another quarter until the next round of quarterly inflation data is released.
Mickenbecker said that while it’s too early to call, an economy in recession and with high inflation awakens memories of 1970’s stagflation.
“That put central bankers between a rock and a hard place, either tolerating higher inflation or triggering job losses. It took the world a long time to recover way back then,” he said.
“Impending tax cuts and the minimum pay rate decision could throw a lifeline to the economy and haul it back to healthier growth but will at the same time add to inflationary pressures.”
Government final consumption expenditure rose 1.0% in March. Both national (+1.2%) and state and local (+0.8%) spending contributed to this increase.
“Government benefits for households drove the growth in government spending, as the federal government increased spending on medical services and some State governments provided energy bill relief payments,” Keenan said.
Household spending rose 0.4% in the March quarter.
“Essential categories like electricity, health, rent and food drove growth again this quarter.
“We also saw increases in some discretionary categories because of overseas travel and spending on gambling, sporting and musical events,” Keenan said.
Total capital investment fell 0.9%.
“Private investment fell by 0.8% driven by a decline of 4.3% in non-dwelling investment. This was due to a reduction in mining investment as well as a reduction in the number of small to medium building projects under construction compared to December,” Keenan said.
Total dwellings (-0.5%) and ownership transfer costs (-2.2%) also detracted from private capital growth, reflecting falling building approvals and subdued activity in the property market.
Machinery and equipment partly offset these falls, rising 2.2%, after a fall last quarter due to increased data centre and transport equipment investment.
Public capital investment fell for the second straight quarter, driven by reduced state and local public sector investment. Water, energy, transport, health and education infrastructure all contributed to this drop.
“Despite the falls in public and private investment, the level of overall investment remained high and continued to exceed mining investment boom levels seen in the early 2010s,” Keenan said.
Net trade detracted 0.9 percentage points from GDP growth this quarter, with stronger imports (+5.1%) than exports (+0.7%).
Goods imports rose 6.5% as consumption and capital goods all increased. Services imports rose 0.7%, driven by transport services, while travel services saw its second quarterly fall as travellers reduced their overseas spending.
Goods exports rose 1.1%, driven by liquified natural gas, non-monetary gold and meat. These increases were partly offset by falls in exports of coal and other rural goods. Services exports fell 1.1%, mainly due to a fall in travel services.
Change in inventories rose $2.2 billion in the March quarter, contributing 0.7 percentage points to GDP growth.
Wholesale and retail inventories run down last quarter were rebuilt with the increase in imports. Metal ore and non-metallic mineral mining drove the rise in mining inventories, as production rose more than demand.
This reduced demand for mining commodities led to a 5.3% fall in mining profits this quarter, after a 7.9% rise last quarter.
Compensation of employees (COE) rose 1.0% in the March quarter, the smallest growth since September 2021. This indicates slowing growth in the labour market.
Private sector wages rose 0.9%, driving the growth in total compensation of employees, and public sector wages rose 1.6%. Pay rises and backpay across federal, state and territory governments contributed to this overall growth.
The household saving ratio fell to 0.9% in the March quarter after rising last quarter.
“Household income received grew at its lowest rate since December 2021, reflecting the relatively small rises in compensation of employees and investment income received this quarter,” Keenan said.
“Compared to last quarter, the growth in income tax payable did not detract as much from total income payable by households, resulting in a lower household saving ratio.”